Top Takeaways from M+R’s 2017 Nonprofit Benchmarks Study
3 min to read ✭
Summary: In case you missed it, M+R’s 11th Benchmarks Study of nonprofit digital advocacy, fundraising, social and advertising was released earlier this month, and the report is an absolute must read for all nonprofit leaders looking to utilize the digital space to scale both revenue and impact.
Below is a quick breakdown of the top takeaways and insights from the study that can directly impact and improve your 2017 digital and fundraising strategies.
Top 2017 Digital Takeaways & Insights for Nonprofit Leaders
The report is jam-packed with so much nonprofit data goodness that it is hard to boil it down into a few top takeaways (so check out the full report if you haven’t already), but here we go:
- Traffic to Nonprofit Websites Grew by 4% in 2016 – If your website traffic isn’t increasing, you are likely behind pace in your space.
- Online Revenue Grew by 15% from 2015 to 2016 – More and more people are giving online, as well as, monthly online giving grew by 23% in 2016.
- Investing in Digital Advertising Increased by 69% in 2016 – Out of 133 participating nonprofits, 100 invested in digital advertising, including search advertising (ie. Google AdWords), display advertising (ie. Google remarketing ads), social advertising (ie. Facebook advertising).
- Email Accounted for 26% of All Online Revenue in 2016 – Email marketing continues to prove that it is a very effective tool to drive new donors and increase online donor lifetime value.
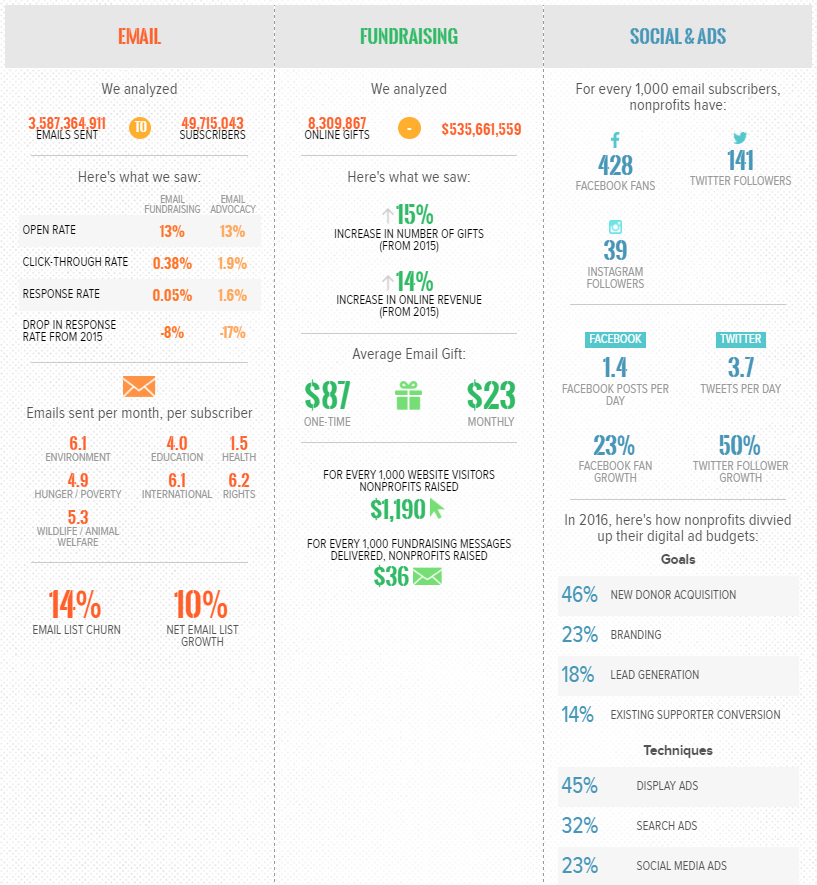
- For Every 1,000 Email Messages Delivered, Nonprofits Raised $36 – If your cause calculates its total sends, you can calculate and compare how your cause measures up in email profitability.
- Nonprofits Had to Deliver 2,000 Fundraising Emails to Generate a Single Donation – For fundraising messages the response rate was just 0.05%
- Email Open Rates Dropped by 7% – However, nonprofit email open rates dropped by 7% in 2016, averaging now at just 15%. If segmentation and personalization is not a part of your email strategy, your organization’s open rates and results will struggle and get worse in 2017 and beyond.
- Nonprofit Email Lists Continue to Grow, Increasing by 10% in 2016 – Supporters continue to be comfortable opting into their favorite causes email lists and staying informed through the channel.
- On Average, a Subscriber Can Expect 69 Separate Email Messages from a Single Nonprofit – Email volume increased by an additional 10% last year. It makes sense more nonprofits continue to ramp up email sends, as its a very cost effective, positive ROI channel. As donors and supporters continue to receive more and more email from the organization’s they are subscribed to, it is essential organization’s push to improve email personalization and segmentation.
- Instagram Followings Has the Largest Growth for Nonprofits at 101% – For nonprofits, Facebook audiences grew 24%, Twitter 50% and Instagram with a massive 101%. There is no debating the engagement levels on Instagram are incredibly high, especially with Instagram Stories being recently released.
Benchmarks 2017 Infographic
The incredible M+R team worked with 133 nonprofits to put together the report. See the participating nonprofits here.

Final Thoughts
Once again, the report from M+R Benchmarks was incredibly well done, be sure to carve out ample time to check out the data.
It is imperative that nonprofits continue to put themselves in their donors’ shoes. Donors and supporters continue to trust and give more online, however, the noise and asks from organizations continues to increase. The nonprofits that systematically segment and personalize their messages and asks, will rise to the top and succeed.


